
Task summaryWhat you will learn:
How to break an everyday task down into a series of instructions/commands that can be easily understood How you will be assessed: Through submission of a flowchart, this can be drawn by hand or on your iPads (using poplet) or using your computers (try Lucid Chart) |
Key terminologyCommand:
A simplified, concise instruction given (to a computer) to carry out an operation Decomposition: Breaking a problem down into a series of smaller tasks or instructions/commands Flowchart: A graphical representation of a series of instructions/commands that are followed to solve a problem |
Activities
|
|
Making a jam sandwichEveryday we (as humans) carry out millions of tasks, we make millions of decisions in every aspect of our lives. Computers are not too dissimilar. The problem they have is that they do not understand humans too well. They really need a task to be decomposed to make sure it understandable. Take a look at the video to the left.
Take an everyday task (making a cup of tea, getting ready for school, feeding the cat etc.) and write a series of commands that explain how to do the task. You could use pen and paper or a note app to write down your commands. After a few minutes swap your work with a peer. |
Assessment Task 1
FlowchartsA flowchart is a graphical representation of a problem. They use shapes and lines/arrows to decompose (break down) a problem into a series of commands (steps) that can be followed easily to solve a problem.
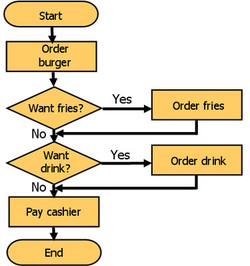
Using the commands your wrote in the activity create a flowchart. Use the example on the right to help you with the structure of your own chart. Take a look at the second image to get an idea of the shapes and how they are used. 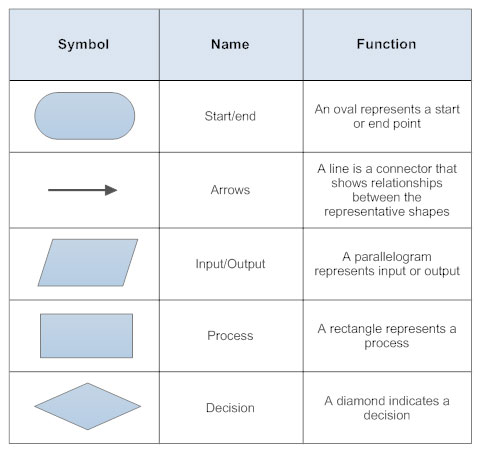
|
Start/end - is simply used to signify the start and end of the flowchart.
Arrows - the direction of these are very important as they show the direction in which we move or flow through the chart. There should be two arrows which stem from a decision diamond. Input/Output - these are used to show when something is added to the process (e.g. Add sugar) or when something is output (e.g. Turn light on). You do not have to worry about using these in your flowchart unless you really want to. You can just use the process rectangle. Process - a command or step in the chart (e.g. Place tea bag in cup), these are normally simple, easy to follow instructions. Decision - A rhombus or diamond used to represent a question or a place in the flowchart where a decision needs to take place (e.g. Add milk) |
|
Going for Gold |
Make sure that your flowchart uses all of the correct shapes and shows accurate use of lines and arrows. Your flowchart should also show use of at least one decision. You may also want to consider the use of input and output shapes.
|
